

Data analytics for scale-ups and SMEs
We define the metrics that matter, connect your data and get trusted numbers into the right hands.
What we do
Plan, build, and support data and analytics capabilities for scale-ups, and established SMEs

enabling better decisions, performance tracking, and investor-ready reporting.
Proud Partner of

You are a good fit if…
You’re scaling and want to see run rate, retention and unit economics.

You’re a mature SME digitising and need clearer visibility to tighten performance and improve margins.

You’re a founder or operator who needs reliable reporting for decisions and accountability.

Your data is spread across tools and teams and you need a single source of truth with clear definitions.

You’re raising, refinancing, or selling and your metrics need to be traceable and defensible.

You want repeatable reporting that keeps pace as your business changes.

You want an ongoing analytics partner without hiring an in-house team.

You’re done with slow, expensive one-off projects that ship and then get abandoned.

These are common examples, not a full list. If you have a data analytics challenge, book a call.
How we work
Phase 1: Plan
-
Understand your challenges, current setup and the business questions you need to answer.
What we cover
Goals and what success looks like for you
Current challenges and data stature
Which Decision Areas matter most for your business
What you get
Clear recommendations on next steps
An outline of the planning scope and cost
-
A structured 90-minute strategy session where we develop your Analytics Framework — the foundation of your reporting and metrics strategy.
What you get:
Analytics Framework including:
Clearly defined Decision Areas mapped to your business priorities
Metric definitions with plain-English calculations, interpretation guidance, and data source mapping
Owners, cadence, and delivery format for each audience
Build plan:
Scope, cost and timeline broken down by Decision Area
Dependencies, risks and assumptions
How it is delivered
A working session to confirm priorities and definitions
A written framework you to guide your analytics strategy
A proposed build plan and quote, ready for approval
Pricing
One-off upfront cost of £1750
Next Steps
This output is implementation-ready. You can take it in-house, work with another team, or ask us to build it.
Phase 2: Build
-
We build the analytics capabilities defined in your Analytics Framework, designed to answer a specific set of business questions.
Examples of common Decision Areas:
Revenue Performance: What's our run rate? How is revenue trending? What's driving changes?
Unit Economics: What's our CAC, LTV, margins? Are we profitable per customer?
Retention & Churn: Are customers staying? Who's at risk? What's driving churn?
Cash & Runway: What's our burn rate? How long until we need funding?
Operational Efficiency: Are we using resources well? Where's the waste?
Sales Pipeline: Will we hit target? What's our conversion rate?
These are common examples. Your Analytics Framework may include others specific to your business.
What's included in each Decision Area
Metric definitions and documentation
Data source connections required
Data quality checks
Dashboard or reporting view for your primary audience
All metrics needed to answer the core questions
Pricing
Build pricing depends on the number of Decision Areas and their complexity.Factors impacting complexity can include the number and quality of data sources, metric logic, definition clarity, number of audiences and delivery method.
Typical range: £4000 – £8,000 per Decision Area
We'll give you a clear quote after the Strategic Workshop, broken down by Decision Area so you can prioritise what to build first.
Phase 3: Support
-
Keep your live Decision Areas running smoothly.
For teams who need reliability and upkeep but don't have capacity in-house.
Included
Bug fixes and dashboard breaks
Data refresh fails
Schema changes from source systems
Small display adjustments
One 30 min monthly check-in (optional)
Email support
Not included
New metrics or Decision Areas
Changes to calculation logic
New reporting views
Pricing:
Monthly per Decision Area.
Total cost varies based on the number of Decision Areas and complexity, starting at £500 per month.
-
Request new Decision Areas or changes to existing ones as you need them.
Best if you have occasional needs but don't want a standing commitment.
How it works
You request a new Decision Area, metric, or change
We scope and quote
We build and deliver
Examples
Add a new Decision Area
Connect a new data source
Build an additional reporting view for a different audience
Significant changes to existing metric logic
Pricing
Quoted per request using the same pricing framework as Build
-
Ongoing strategic oversight combined with monthly development capacity.
Best for teams looking for proactive strategy combined with technical implementation that can keep up with your evolving priorities.
Included
Everything in Maintenance
Ongoing access to our team for continuous iteration
Flexible prioritisation: we agree what matters most, then execute
Monthly priority and progress review
Proactive recommendations based on what we see in your data
Quarterly strategy session (90 mins)
Priority support (response within 1 business day)
Typical monthly output
1 new Decision Area per quarter, OR
2-3 significant enhancements to existing areas, OR
A mix based on your priorities
Pricing
3 months: £2,990/month
6 months: £2,750/month (popular)
12 months: £2,500/month
Case study
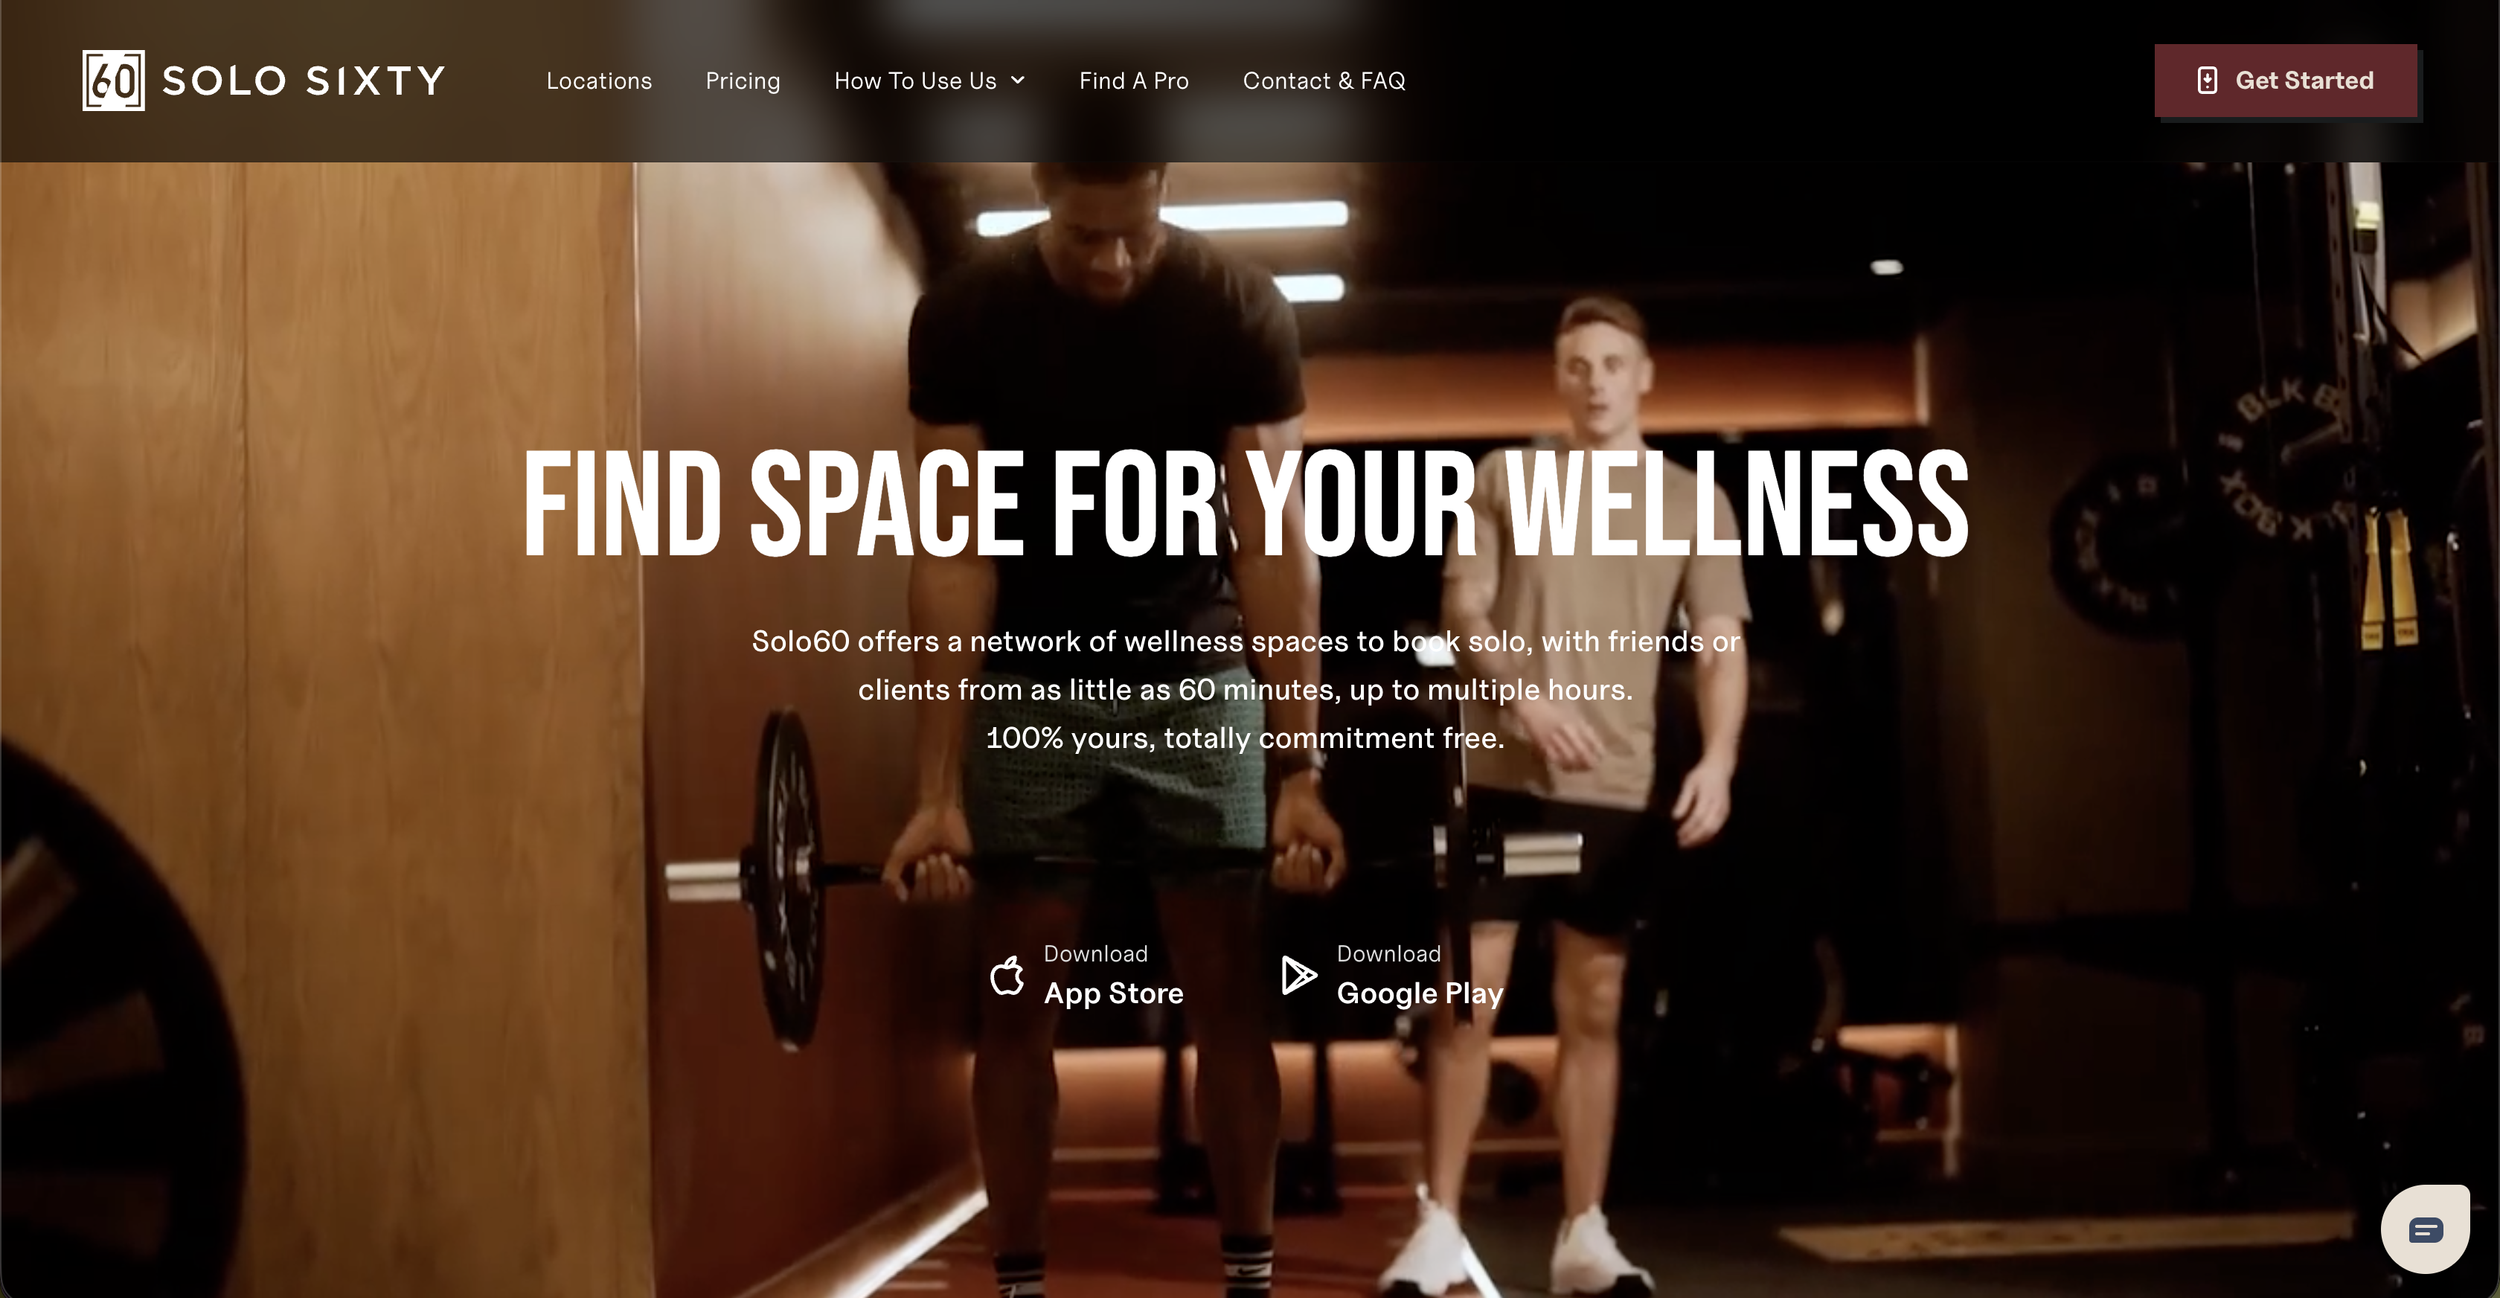
Helping scale London’s leading network of private wellness spaces.

Client:
“Morpho Analytics helped us establish our trusted unit economics and track what really moves the needle.”
Ben Alderton - Founder & CEO
Background
Solo60 is the leading UK operator of private, self-service micro-gyms and wellness spaces. Users get exclusive access to high-quality spaces without crowds, classes or fixed schedules.
Their business model depends on matching demand to available time across a growing network, and converting first-time users into repeat bookers over time.
Challenge
As their network of sites grow, key performance questions become harder to answer quickly. Finance, operations and technology data is siloed across multiple systems, making it difficult for leadership to trust important metrics such as utilisation by site or time, site value, customer churn and repeat booking rate.
Solution
Morpho Analytics partnered with Solo60 to design a single, decision-ready reporting layer and dashboards that bring Solo60’s core operating levers into one place, in a format that’s easy to digest for key stakeholders.
For this layer we chose Hex because it embeds cleanly into existing internal systems, is data secure but mostly due to its usability. Stakeholders can filter, drill down, and explore without needing an analyst in the loop each time and it also supports AI-assisted, chat-style querying inside a governed workspace, so teams can ask questions without exporting sensitive data, and they can see exactly what the answers are based on in the underlying data and logic.
Impact
Solo60 receives a single, trusted view of performance across the network, with decision-ready dashboards that answer the questions leadership ask every week. Instead of stitching together exports, they can see (and ask the chat) exactly where capacity is being wasted, what demand looks like by time band, which sites are outperforming and why, and how pricing and product rules affect revenue per available hour and repeat usage.
The result is faster, more confident decisions and a clear backlog of high-ROI changes to test and ship.

Frequently Asked Questions
-
Morpho Analytics is an analytics partner for leadership teams who need trusted metrics for decisions, performance tracking, and reporting. We define the numbers that matter, connect the right data, and keep reporting reliable as your business changes.
-
Primarily CEOs and CFOs, plus other decision-makers who rely on accurate reporting. We work with UK and international clients — typically scale-ups and established SMEs with £500k–£10m in revenue, often with board or investor reporting requirements.
-
Start with a Discovery Call. If we're a good fit, we move into the Strategic Workshop to define what you should track and how reporting should work.
-
An Analytics Framework is a structured blueprint that defines your metrics, Decision Areas, and reporting plan.
Price: £1,750
Timeline: Typically two weeks after the Strategic Workshop, depending on stakeholder availability.
-
A Decision Area is everything you need to confidently answer a specific set of business questions on an ongoing basis.
For example, "Revenue Performance" includes all the metrics, data connections, dashboards, and documentation needed to answer: What's our run rate? How is revenue trending? What's driving changes?
Common Decision Areas include Revenue Performance, Unit Economics, Retention & Churn, Cash & Runway, Operational Efficiency, and Sales Pipeline — but yours will be defined based on your business model, stage and priorities.
-
Plan: £1,750 for the Strategic Workshop and Analytics Framework
Build: £3,000–£8,000 per Decision Area, depending on complexity
Support: From £399/month for Maintenance, or £2,250–£2,750/month for Strategic Partner
Build pricing depends on data complexity, metric logic, and how many audiences need reporting. We quote after the Strategic Workshop so you know the cost before committing.
-
Everything needed to answer the core business questions for that area:
Relevant metrics and KPIs
Data source connections
Dashboard or reporting view
Metric definitions and documentation
Data quality checks
One round of refinement after delivery
-
-
You move to Support. Maintenance keeps your Decision Areas running reliably. On-Demand lets you request changes or additions as needed. Strategic Partner gives you ongoing development capacity plus strategic oversight. And of course, when you’re ready, we can also hand everything over to your own in-house team.